Blog
Fundamental vs. Technical Analysis: 3 Ways for Investors and Traders
Learn how fundamental analysis values a business, technical analysis frames timing, and three workflows combine both, with clear hypothetical examples.

Fundamental analysis answers what a business is worth; technical analysis answers when to act on that view. The two methods draw on different inputs, operate on different timeframes, and answer different questions, which is why many investors and traders use fundamentals to select candidates and technicals to time entries and exits. Neither approach guarantees an outcome, and the short, labeled examples and workflows below show how each one works and where the two intersect.
TL;DR:
- Fundamental data updates quarterly, while technical signals change with every trade; models can rely on stale figures, and charts can mislead in choppy, thin markets.
- A day trader may use a 9 period average on 5 minute charts; swing traders use 50 day and 200 day averages on daily charts.
- Frequent trading adds fees and taxes; swing traders may use chart signals, while long term investors need valuation work and patience through price gaps.
- Before testing a combined strategy, guard against survivorship, look ahead, and data snooping biases, and set position sizes and risk limits before reviewing results.
Table of Contents
- What is fundamental analysis and how does it value a business
- What is technical analysis and how do traders time decisions
- Fundamental vs. technical analysis: the key differences
- When to use fundamental analysis, technical analysis, or both
- Three ways to combine fundamental and technical analysis
- How transparent valuation tools support the fundamental side of the work
- The most useful skill is knowing which tool fits the question
- See the assumptions behind a fair-value estimate
- FAQ
- Sources
What is fundamental analysis and how does it value a business
Fundamental analysis estimates a company’s intrinsic value by examining the economics of the underlying business rather than its stock chart. The question it answers is straightforward: based on what this company earns and owns, what is it actually worth?
The inputs come from a company’s financial statements and the broader context around them. The SEC’s beginners’ guide to financial statements identifies the core sources analysts rely on:
- Balance sheet: assets, liabilities and equity at a point in time.
- Income statement: revenue, expenses and profit over a period.
- Cash flow statement: cash generated and consumed by operations, investing and financing.
- Industry context: competitive position, margins relative to peers, and demand trends.
- Management analysis: capital allocation decisions and how leadership has executed over time.
From these inputs, analysts commonly apply a discounted cash flow model, which projects future cash flows and discounts them to a present value using a required rate of return. Others lean on peer multiples such as price-to-earnings or price-to-sales, comparing a company’s valuation to similar businesses. Dividend-based models work best for mature, cash-generative companies with a stable payout history. Each method has a context where it fits better: DCF suits businesses with predictable cash flows, multiples work well for quick comparisons across a sector, and dividend models fit income-focused holdings.
A hypothetical company, illustrative numbers only: say a business generates $50 million in free cash flow, growing 5% annually, discounted at a 9% required return. A simplified DCF might imply a present value meaningfully different from where the stock trades, which is the gap fundamental analysis is built to surface. The SEC beginners’ guide and FINRA’s evaluating stocks resource both point to filings as the starting point for this kind of work.

Pro Tip: Read the cash flow statement before the income statement. Earnings can be shaped by accounting choices, but cash is harder to dress up.
What is technical analysis and how do traders time decisions
Technical analysis works from a different premise: that price and volume already reflect the collective behavior of everyone trading a security, so studying price history can reveal where it might go next. Rather than asking what a company is worth, it asks when momentum, trend or exhaustion signals suggest a favorable entry or exit.
Common tools include:
- Candlestick charts, which show open, high, low and close for a given period.
- Moving averages, which smooth price action to reveal trend direction.
- RSI (Relative Strength Index), which flags overbought or oversold conditions.
- MACD (Moving Average Convergence Divergence), which tracks momentum shifts between two moving averages.
- Support and resistance levels, price zones where buying or selling pressure has historically clustered.
- Volume confirmation, which checks whether a price move is backed by meaningful participation.
According to CFA Institute’s comparison of the two disciplines, technicians adjust indicator settings based on timeframe: a day trader might use a 9-period moving average on 5-minute charts, while a swing trader working with daily charts often favors 50-day and 200-day averages. Intraday, swing and positional traders all use the same toolkit, just calibrated differently.
A labeled hypothetical example: suppose a stock’s 20-day moving average crosses above its 50-day moving average, and the crossover coincides with volume running well above its recent average. Some traders would read that as a bullish signal worth acting on. The crossover does not guarantee the trend continues, and whipsaws, where price reverses shortly after a signal fires, are a known limitation of trend-following indicators.
Pro Tip: No single indicator works in isolation. Pair a trend signal like a moving average crossover with a volume check before treating it as confirmation.
Fundamental vs. technical analysis: the key differences
The clearest way to separate the two methods is by what question each one answers and what it costs to apply well.
- Question answered: fundamental analysis answers what a business is worth; technical analysis answers when price action suggests a move.
- Time horizon: fundamental work tends to suit holding periods measured in years; technical work often operates on timeframes from minutes to months.
- Data cadence: fundamentals update quarterly with earnings releases; technical signals update continuously with every trade.
- Core skill: fundamental analysis rewards accounting literacy and industry knowledge; technical analysis rewards pattern recognition and discipline around signals.
- Failure mode: fundamental models can rely on stale data between reporting periods; technical signals can produce false positives in choppy, low-volume markets.
One documented tradeoff is worth naming directly: CFA Institute research on technical analysis has found cross-sectional profitability in trend-following strategies, particularly when information uncertainty around a company is high, though these strategies also carry documented crash risk and require active risk management. That tension, usefulness under uncertainty paired with exposure to sharp reversals, explains why technical signals are rarely treated as a standalone system by careful practitioners.
Transaction costs matter more for technical strategies, since frequent trading compounds fees and taxes, while fundamental investing typically involves fewer transactions but demands patience through periods where the stock price and the estimated value diverge. Filings referenced in SEC disclosures on market and model risk note that neither approach substitutes for individual due diligence, and that both carry the risk of loss.
When to use fundamental analysis, technical analysis, or both
Choosing a method starts with being honest about the objective, not the market’s mood.
- Objective: are you selecting a business to own for years, or a position to trade over days or weeks?
- Time available: fundamental research demands hours reading filings; technical monitoring demands ongoing attention to price action.
- Capital allocation: a long-term allocation to a handful of businesses behaves differently from active position sizing across frequent trades.
- Transaction costs and taxes: frequent trading triggers more taxable events and more fees, which erodes returns that technical signals alone may not offset.
- Portfolio context: a single position’s role, core holding versus tactical trade, should match the analysis method used to justify it.
A few scenarios illustrate how this plays out. A long-term investor building a position around a company’s earnings power leans on valuation first, checking whether the current price offers a reasonable margin of safety relative to an estimate of intrinsic value. A swing trader looking for a multi-week move leans on technical signals, since the holding period is too short for fundamentals to change materially. Someone rebalancing a portfolio quarterly might use fundamentals to decide what to trim or add, then use technical signals to choose the week to execute. An event-driven trader watching an earnings release or analyst revision often blends both, using the fundamental catalyst to decide direction and a technical trigger to decide timing.
Three ways to combine fundamental and technical analysis
Combining the two disciplines is less about picking a side and more about assigning each one a job it does well.
- Valuation-first, then technical timing: identify candidates where a reasonable estimate of value diverges from price, then wait for a technical signal, a moving average crossover or a support-level bounce, before entering.
- Technical screen, then fundamental due diligence: scan for price and volume patterns across a universe of stocks, then apply fundamental checks (balance sheet strength, cash flow quality) before committing capital.
- Quant-amental fusion: score companies on fundamental factors and overlay price momentum, a structured approach CFA Institute’s research on fundamental momentum describes as a way to combine improving company fundamentals with momentum signals to manage exposure across market regimes.
Backtesting any of these workflows requires guarding against a few well-known biases: survivorship bias, which excludes delisted or failed companies from historical samples; look-ahead bias, which accidentally uses information not yet available at the time of a decision; and data-snooping, which overfits a strategy to the specific historical period being tested. Position sizing and risk limits should be set conceptually before testing, not adjusted after seeing favorable results. One pairing practitioners cite often: an earnings revision (a fundamental signal) combined with price momentum (a technical signal) tends to capture different pieces of the same information gap.
Pro Tip: Paper-trade any hybrid workflow for a full market cycle before committing real capital, since both fundamental and technical signals behave differently in trending versus choppy conditions.
How transparent valuation tools support the fundamental side of the work
Running a fundamental check is only as useful as the assumptions behind it, which is why an auditable model matters as much as the output.
- A transparent fair-value tool should show every assumption used, growth rate, discount rate, terminal value, alongside the filing or data feed it came from.
- Editable growth and discount-rate inputs let you run sensitivity checks, seeing how the estimate shifts if assumptions change, and reverse DCFs, working backward from the current price to see what growth rate it implies.
- Outputs like these are educational estimates, not investment advice, recommendations or price targets.
Our own methodology documents exactly this kind of model for readers who want to inspect the math rather than take a number on faith.
The most useful skill is knowing which tool fits the question
We think the more productive framing is not fundamental against technical, but a tradesperson choosing the right tool from two toolboxes. A model’s output is only as trustworthy as its assumptions, and a chart pattern is only as useful as the risk management around it. Testing both approaches systematically, and paper-trading before deploying real capital, tends to produce steadier decisions than committing to one school on principle. No method, used alone or combined, guarantees an outcome.
— Miraaj Patel
See the assumptions behind a fair-value estimate
A typical fair-value estimate includes a numerical score and a letter grade, built from discounted cash flow, peer multiples, asset value and dividend models, with all assumptions and data sources shown next to the number.
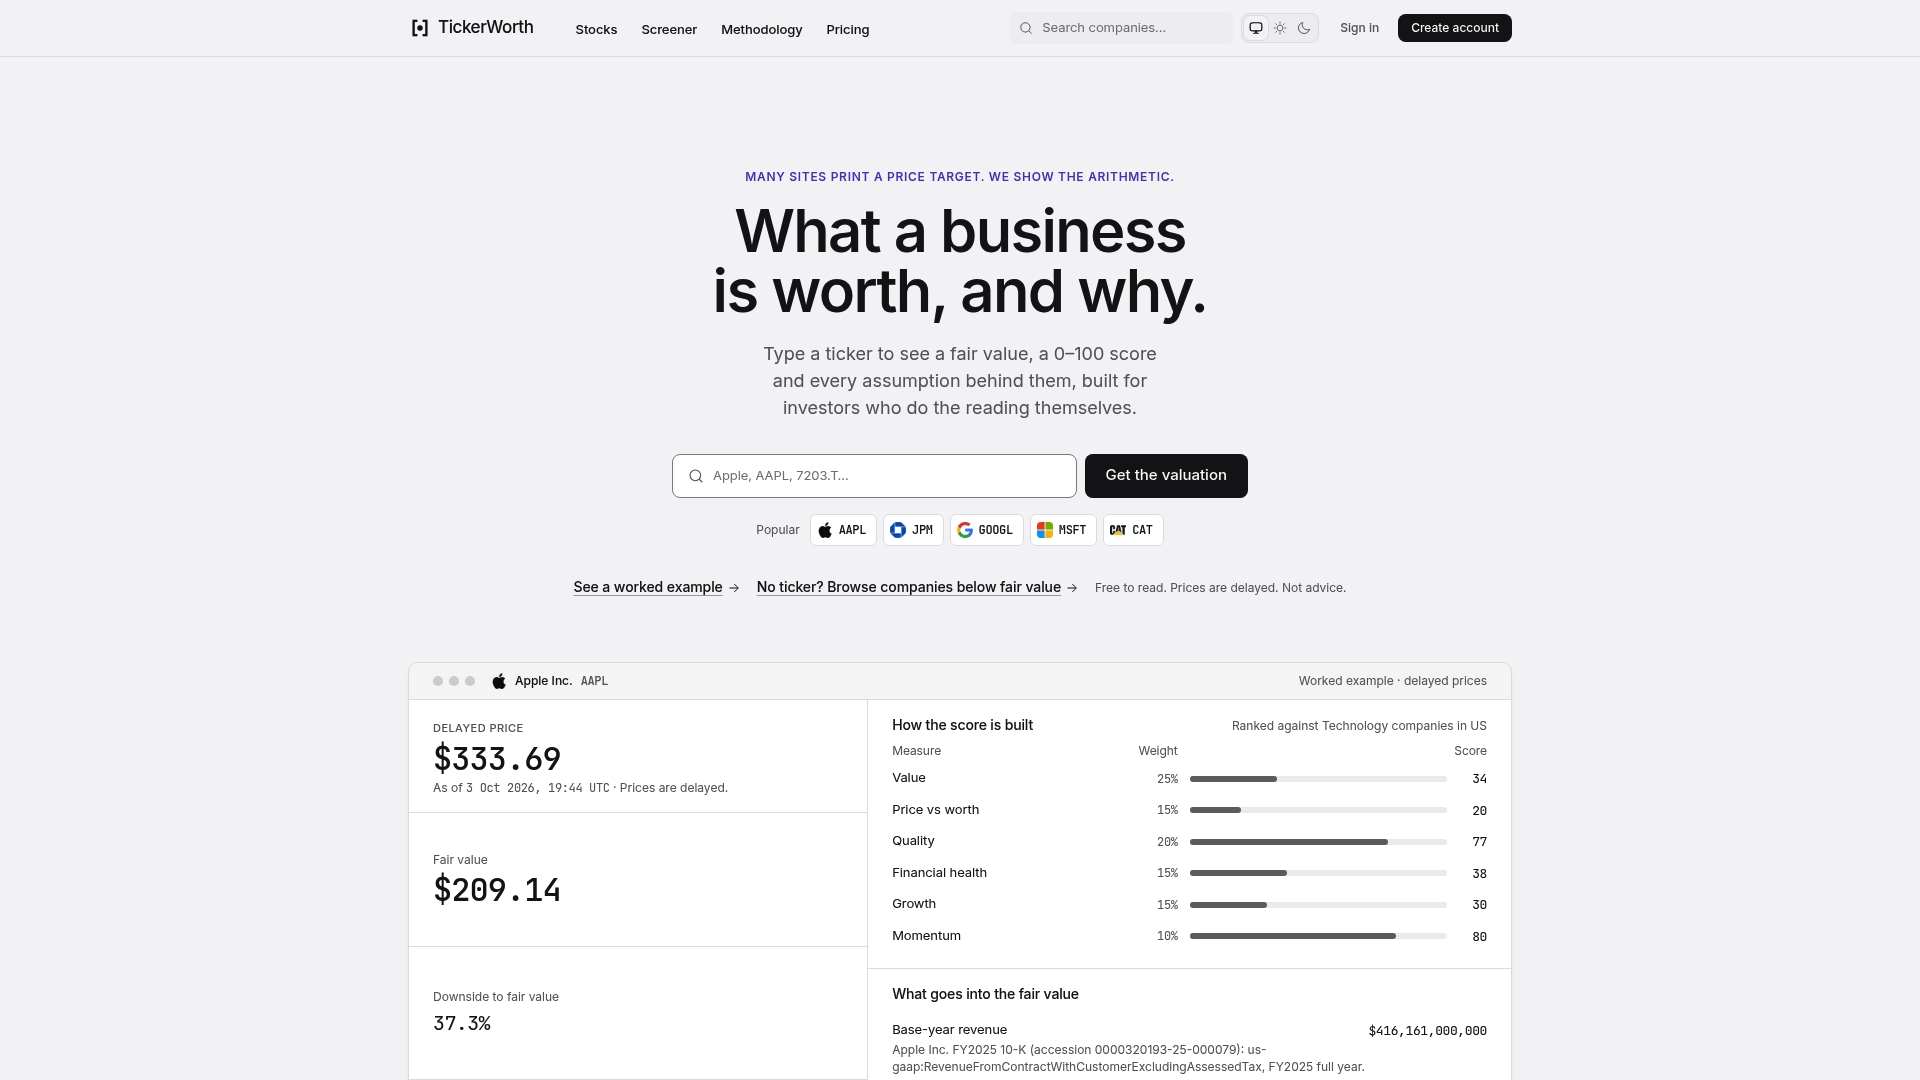
Reading is free for every covered company. Our Pro plan, available for $99 per year or $14.99 per month, adds the editable model with adjustable growth, WACC and inflation dials, the full screener, a downloadable workbook and alerts. If you want to see how a company’s filings translate into a valuation estimate, start with our fair value and screener tools.
This article is general information, not a substitute for advice from a qualified financial advisor. Consult a qualified financial professional about your own circumstances before acting on anything here.
FAQ
What is better, fundamental or technical analysis?
Neither method is universally better; they answer different questions. CFA Institute’s comparison of the two notes that fundamental analysis is generally better suited to long-term valuation decisions, while technical analysis is better suited to timing entries and exits, and many practitioners use both.
Should I learn fundamental or technical analysis first?
There is no single required order, and the right starting point depends on your goal: long-term investors often benefit from learning to read financial statements first, using the SEC’s beginners’ guide as a starting point, while active traders may prioritize chart reading and indicators. Many practitioners eventually learn both, since each supports different decisions in the same portfolio.
Does JP Morgan use technical analysis?
Public sourcing does not let us confirm specific trading desk practices at named institutions, so we cannot state this as a verified fact. More broadly, CFA Institute commentary notes that many institutional practitioners use technical tools alongside fundamental research rather than relying on either exclusively.
What financial statements matter most for fundamental analysis?
The balance sheet, income statement and cash flow statement are the three core documents, as outlined in the SEC’s guide to financial statements. FINRA’s evaluating stocks resource recommends reading a company’s 10-K and 10-Q filings and comparing ratios like EPS and P/E against peers as a starting point.
Can combining fundamental and technical analysis reduce risk?
Combining the two does not eliminate risk, since both carry model and market risk, but CFA Institute research on fundamental momentum suggests that blending fundamental scores with momentum signals can offer a more structured way to manage exposure than relying on either signal alone. Any strategy still requires individual due diligence and testing before committing capital.
Sources
- SEC – Beginners’ Guide to Financial Statements
- CFA Institute — Fundamental vs. Technical Analysis
- FINRA — Evaluating Stocks
Recommended
- Three Portfolio Evidence Based Investing for Practitioners Using SPIVA
- Terminal Value Methods: A Checklist for Practitioners
- Model First Margin of Safety Calculation for Self Directed Investors
- Asset Based Valuation for Investors: 4 Steps and an Auditable Example
This article was written with AI assistance and edited for TickerWorth. It is educational only and is not investment advice, a recommendation or a price target. Figures are as of the publish date; for the live, sourced valuation of any company, see tickerworth.com.
Fair value
Check any ticker’s fair value
Type a ticker for today’s estimate of what the business is worth, with every assumption and where it came from. When the data can’t support a number, the page says why.